
Fundamentals
How the 2026 Federal Tax Brackets Actually Work
Seeing “22% bracket” often triggers the wrong conclusion: that 22% applies to an entire salary. The useful question is narrower—how much taxable ordinary income reaches each layer after the inputs this simplified calculator accepts?
8 minute read · 2026 U.S. federal tax
See the mechanism
Build taxable income
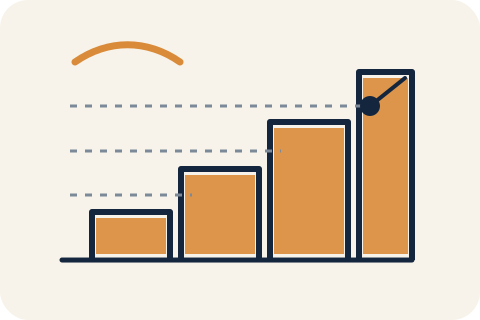
- 1Build taxable income
- 2Fill bracket layers
- 3Read marginal and effective rates
Start with the amount the brackets actually see
In estimate mode, TaxArith begins with annual income, subtracts entered pre-tax adjustments without going below zero, and then subtracts either the 2026 basic standard deduction or a custom deduction. What remains is taxable income for this narrow ordinary-income calculation.
In taxable-income mode, the first two steps disappear. That mode is appropriate only when a reliable taxable-income figure has already been prepared; entering salary there would skip the deduction and overstate this model’s tax.
Taxable income fills lower brackets first
The occupied layers come directly from the production bracket calculation for the published single-filer scenario.
A bracket is a layer, not a single price tag
The first dollars of taxable income occupy the lowest bracket. Only the portion above that bracket’s ceiling moves to the next rate, and the process continues until all taxable income has been allocated.
The marginal rate is the rate on the top occupied layer. The effective rate divides estimated tax by taxable income, so it reflects all occupied layers together. Neither number is an effective rate on gross salary.
- Taxable income determines which layers are occupied.
- The marginal rate describes the last occupied layer.
- The effective rate summarizes the full bracket calculation.
Picture the top dollars, not the whole paycheck
Suppose a filer has taxable income just below the next bracket ceiling and then earns a small amount of additional ordinary income. Only the portion that crosses the ceiling enters the higher layer; the dollars already placed in lower brackets keep their original rates. That is the practical meaning of marginal taxation.
What changes the estimate most
Prioritize the inputs that can move this model before refining smaller details.
Taxable income
High
Determines how many bracket layers are occupied.
Filing status
High
Selects both bracket boundaries and the standard deduction.
Adjustment or deduction
Medium
Reduces the income that reaches the stack when supported.
Income, adjustments, and deduction move together
An additional dollar of annual income does not always become an additional dollar of taxable income if another submitted input changes at the same time. Conversely, a larger supported adjustment or deduction can reduce the top occupied layer before it affects lower layers.
Filing status changes both the standard deduction and bracket boundaries. It should be selected from the status expected on the federal return, not chosen because one calculator result looks smaller.
Use the breakdown to audit the estimate
Check that the taxable amounts across the displayed brackets add back to taxable income. Then check that each row’s tax equals that row’s taxable amount times its rate; the row taxes add to the estimate.
A filed return can differ because this tool omits qualified-dividend and long-term-gain rates, credits, additional taxes, phaseouts, special deductions, IRS Tax Table conventions, and return-specific rounding.
The calculation boundary
The left side enters this model; the right side still requires another calculation or review.
Inside the boundary
- Ordinary taxable income
- 2026 filing-status brackets
- Basic standard or custom deduction
Outside the boundary
- Credits and payments
- Preferential-rate income
- AMT, NIIT, payroll, state and local tax
Before you use the estimate
- Choose estimate mode or taxable-income mode deliberately.
- Confirm filing status and the 2026 tax year.
- Support every adjustment or custom deduction outside the calculator.
- Reconcile bracket-row taxable amounts to the displayed taxable income.
Where this estimate stops
- Ordinary federal income tax only; no preferential-rate income or credits.
- No determination of AGI, deduction eligibility, filing status, AMT, NIIT, payroll tax, or state and local tax.
Sources and references
Only the primary federal sources used for the rules discussed in this guide are listed here.
- Revenue Procedure 2025-32
Internal Revenue Service · The inflation-adjusted 2026 ordinary brackets, standard deductions, preferential-rate thresholds, and other indexed amounts used by the applicable calculation.
TaxArith provides illustrative 2026 U.S. federal tax estimates for general information. It is not tax, legal, financial, or investment advice and does not prepare or file a return. Results depend on the accuracy and completeness of the submitted facts.